On-Chain Data School (Part Four): Visualizing BTC UTXO Age Price Distribution Chart


Original Article Title: "On-chain Data Classroom (Part 4): Visualizing the $BTC Chip Price Distribution Chart "
Original Article Author: Mr. Berg, On-chain Data Analyst
This article is the 4th in the On-chain Data Classroom series, which consists of 10 articles in total. Take you step by step to understand on-chain data analysis. Interested readers are welcome to follow this series of articles.
Related Reading: "On-chain Data Classroom (Part 3): Have the Bottom Fishing Whales Taken Profit?"
TLDR
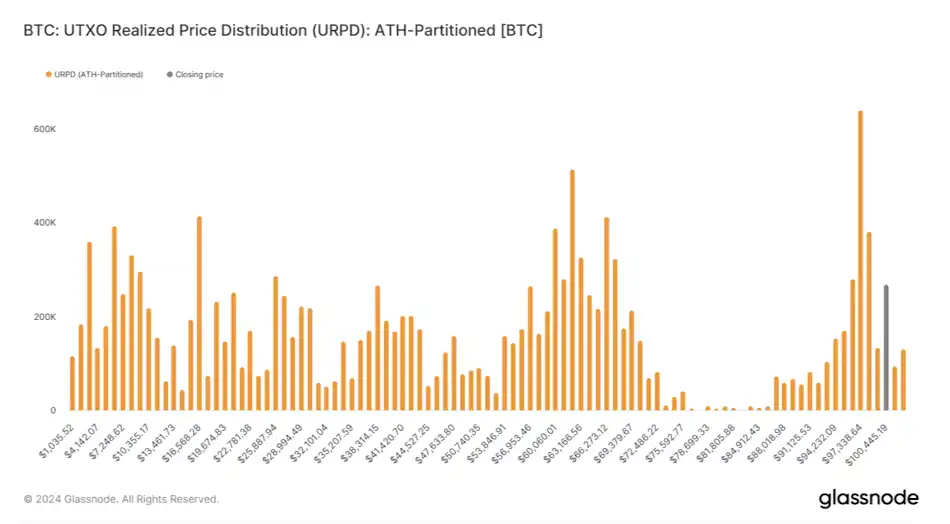
- This article will introduce the on-chain metric URPD
- URPD shows the distribution of $BTC chips at different holding costs
- URPD can be used to observe chip turnover, distribution conditions, and provide guidance on trends
What is URPD?
URPD, short for UTXO Realized Price Distribution.
Due to BTC's unique UTXO blockchain structure,
we can track data on-chain that is unavailable in traditional financial markets.
The URPD chart is an indicator derived from this principle,
where we can see the number of chips corresponding to each price level on the chart,
equivalent to showing the "buying cost of each $BTC."
URPD, Chip Turnover, Accumulation, and Distribution
After understanding the concept of URPD,
we can then observe the turnover of chips at different price levels based on the daily URPD changes.
For example:
Chart one below is the URPD chart for May 1,
while chart two is the URPD chart for October 1.
After experiencing five months of wide-ranging fluctuations in price,
It is quite obvious to see the phenomenon of low-cost chips being distributed upwards.

URPD, Chip Turnover, Accumulation, and Distribution (2)
In history, at a market top, it is usually accompanied by the tail end of high-profit low-cost chip distribution;
while at a market bottom, a large amount of chips can be seen accumulating in a relatively narrow range.
Therefore, in analysis,
URPD is often observed together with other data (such as realized profit, MVRV, etc.),
integrating logical thinking to understand the market from a more comprehensive perspective.

Support, Resistance, Consensus
When a significant amount of chips begins to accumulate in a single price range,
it indicates that a supply-demand consensus has gradually formed in that range.
Once the price later rapidly rises out of that range,
due to the high turnover of chips in that range,
it is likely to provide support in the future;
Conversely, if the price falls below that range,
the chips in that range will become trapped chips,
which may act as resistance levels in future price increases.
Conclusion
The above is all the content of On-Chain Data School (Part Four). For readers interested in delving deeper into on-chain data analysis, remember to keep track of this series of articles!
If you want to see more analysis and educational content on on-chain data, feel free to follow my Twitter handle (X)!
Hope this article has been helpful to you. Thank you for reading.
You may also like

Morning Report | Coinbase Ventures makes its first investment in ENA; SpaceX plans to set the IPO price at $135 per share

Full text and analysis of the speech by the CEO of SanDisk at the 42nd Annual Strategic Decision Conference of Bernstein

Bitcoin Price Prediction 2030: Ark Invest Forecasts $710K

WEEX Review 2026: Fees, Security and Trading Features

SOL Price Today: Live Solana Price, Charts & Market Data

What Is a Bitcoin ETF: Spot vs Futures Explained

Why Is Bitcoin Dropping 15% While Nasdaq Hits Record Highs?

Morning Report | Robinhood completes acquisition of WonderFi for $180 million; Anthropic submits IPO draft application to SEC confidentially; Google plans to raise $80 billion in financing

WSJ: Hyperliquid is becoming Wall Street's crypto "convenience store"

Why do I still have confidence in ETH?

CRCL surges and plummets, COIN follows with a dive: The real battle for interests behind the CLARITY Act

Tokenized US stocks are not the "liquidity killer" of the crypto market

What Is TradFi and Why Is Everyone Talking About It in 2026?

From Poland to Paris: A Look Back at WEEX's Global Community Journey in May 2026

WEEX WXT Eco Carnival: How to Join WXT Events and Plan Trading Tasks
The WEEX WXT Eco Carnival is an ecosystem campaign built around WEEX Token (WXT), designed for users interested in platform tokens, spot trading, futures trading, deposit tasks, and referral rewards.

Morning Report | Strategy sold 32 BTC and over 800,000 shares of MSTR last week; Binance officially announced its U.S. stock trading portal; Polymarket reached an exclusive partnership with OneFootball
Zhou Hang: How much is SpaceX really worth?

